Climate protection dashboard Kevelaer
The pilgrimage town of Kevelaer is actively committed to climate protection and sustainable urban development. To make this commitment visible and comprehensible to all citizens, the climate protection dashboard is now available.
What does the climate protection dashboard show?
The dashboard provides an insight into key figures relating to energy, climate and greenhouse gas emissions in Kevelaer:
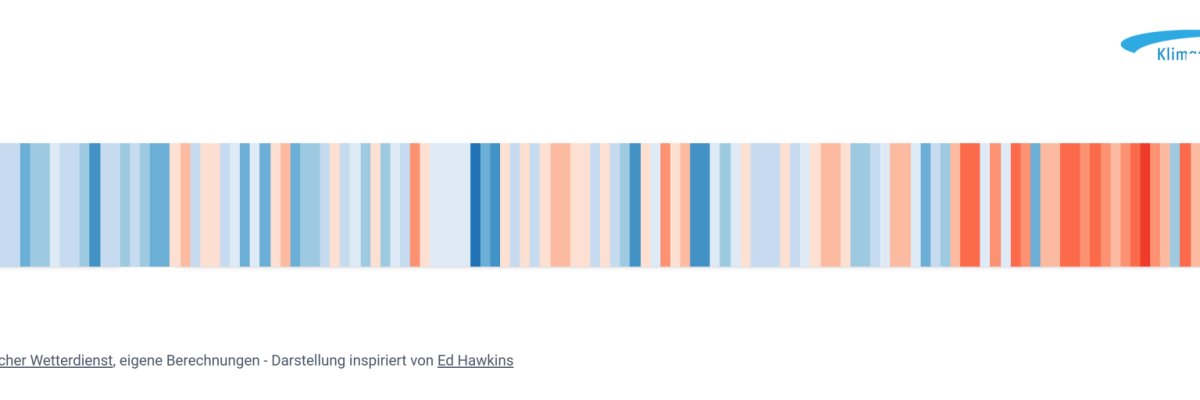
- Temperature development over the last 140 years
- Development of CO₂ emissions and energy consumption
- Share of renewable energies
- Heat and power consumption
The data currently ranges from 2011 to 2021 and is regularly updated by the energy and greenhouse gas balance.
Why a climate protection dashboard?
Climate protection only works together. With the climate protection dashboard, the pilgrimage town of Kevelaer is pursuing three central goals:
- Transparency: All interested parties can see where we stand and how Kevelaer is developing.
- Information: The dashboard makes complex relationships understandable.
- Motivation: Visible progress should encourage people to become active themselves - in everyday life, in the club or in the company.
Climate protection as a joint task
Protecting the climate and environment is a long-term task. The climate protection dashboard shows both successes and the need for action - openly and comprehensibly. The pilgrimage town of Kevelaer cordially invites you to inform yourself, think along and participate.